Run a test#
To run tests, the user needs to have the Run permission. The users with the Team owner and Manage users permissions manage access. For more information, see Permissions.
To run a test, use one of the following methods:
After creating or editing a project, select By running the test you accept the terms and conditions and click Run test.
On the Projects page, click
 for the required test project, go to the Load profile tab and click Run test.
Note
The test will run after some time. If the maximum number of simultaneously running tests is exceeded, the current test will be queued.
After the test is run, the detail page for it is displayed. This page has the following data:
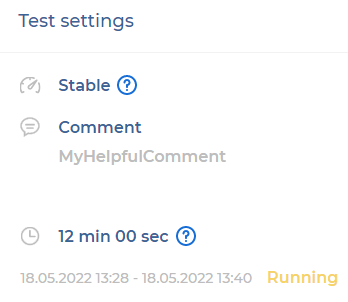
Test settings. Type of load, a comment section, and total test duration:
Current stats. Average test scores for the last 10 seconds:

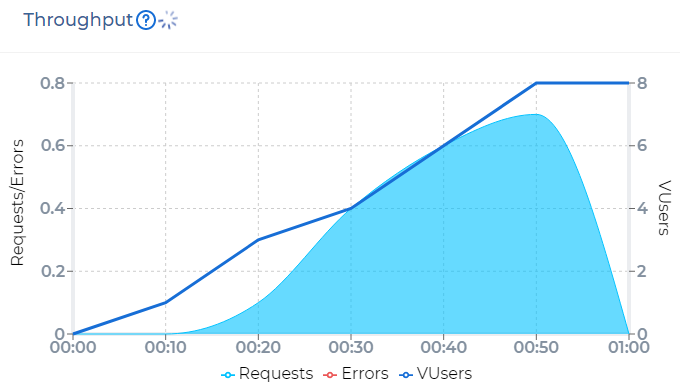
Throughput. Total requests per second and Errors per second plotted against Running VUsers.
Response Time. 95% response time of all requests plotted against Running VUsers. See transaction breakdown in Detailed stats.

To stop a test, click Stop. The test stops after a while.
View results#
After the test is completed, thе page has the following data:
JMeter LOG file:

The Throughput and Response Time graphics.
SLA execution status. You can also add SLA after the test is completed. For more information, see Configure SLA.
Note
If the completed test meets the conditions of the trend report, the trend report will be updated. For more information, see Trend reports.
For more information, see Load Test Analysis
Run a debugging test#
Debugging tests allow you to check the test project. PFLB Platform creates a logical copy of the test, and it runs with the following restrictions:
The test runs with 1 VUser.
1 iteration of the test is performed for a maximum of 5 minutes.
To run a debugging test, on the Load profile tab, click the Debug run toggle and click Run.
View detailed data about requests and responses#
The debug.jtl file contains detailed information about requests and responses. The link to the file becomes available after the debugging test is completed:

For more information, see Apache JMeter Wiki.